Resource Centre
We pride ourselves at Enviro-Stewards as being the partner on your sustainability journey. Below are some great areas to begin!
Decarbonization
What is decarbonization?
Decarbonization is the process of reducing carbon dioxide and other greenhouse gas emissions associated with energy use, industrial processes, buildings, and operations. For organizations, it typically involves improving energy efficiency, transitioning to lower-carbon energy sources, electrifying equipment where feasible, and reducing emissions across operations and supply chains over time.
How is decarbonization different from net zero?
Decarbonization focuses on actively reducing emissions, while net zero is an end state where remaining emissions are balanced by removals or offsets. A credible net-zero pathway prioritizes deep decarbonization first and uses offsets only for emissions that are technically or economically difficult to eliminate.
Why is decarbonization important for businesses today?
Decarbonization helps organizations manage rising energy costs, regulatory pressure, and climate-related risks while improving operational efficiency. Many businesses pursue decarbonization not only to meet environmental goals, but also to strengthen competitiveness, support ESG reporting, and future-proof their assets.
What types of emissions are included in decarbonization efforts?
Decarbonization strategies typically address:
- Scope 1: Direct emissions from on-site fuel use and company-owned equipment
- Scope 2: Indirect emissions from purchased electricity or heat
- Scope 3: Indirect value-chain emissions such as suppliers, transportation, and product use
Most organizations begin with Scope 1 and 2 before expanding into priority Scope 3 categories.
How do organizations start a decarbonization journey?
Most organizations start by establishing a baseline through energy and emissions assessments. This identifies where emissions and costs are concentrated. From there, a phased roadmap is developed that prioritizes low-risk, high-impact actions first, followed by longer-term investments aligned with capital planning.
Does decarbonization always require major capital investment?
No. Many early decarbonization actions are operational or low-cost, such as optimizing schedules, improving controls, upgrading lighting, or reducing wasted energy. These measures often deliver fast paybacks and help fund larger initiatives later, such as electrification or renewable energy projects.
What are the fastest ways to reduce emissions in the short term?
Short-term emissions reductions often come from:
- Energy efficiency improvements
- Operational and behavioral changes
- Equipment optimization and controls tuning
- Eliminating unnecessary energy use
These actions typically provide quick financial returns while laying the groundwork for deeper decarbonization.
How does decarbonization improve financial performance?
Effective decarbonization reduces energy consumption, lowers operating costs, and minimizes exposure to energy price volatility and carbon pricing. When combined with incentives and utility programs, many projects deliver strong returns while also reducing emissions.
What role does energy data play in decarbonization?
Accurate energy data is critical to decarbonization. Without visibility into when, where, and how energy is used, it is difficult to prioritize actions or verify results. Many organizations use energy management systems to support continuous monitoring and improvement as part of their decarbonization strategy.
See how data supports this in practice through Enviro-Stewards’ work with Stewwi EMIS.
How does decarbonization apply to manufacturing environments?
In manufacturing, decarbonization focuses on reducing energy intensity, improving process efficiency, optimizing equipment performance, and transitioning away from high-carbon fuels where feasible. These efforts often align closely with broader sustainable manufacturing initiatives that improve reliability and productivity.
Is decarbonization only relevant for large organizations?
No. Small and mid-sized organizations often have significant decarbonization opportunities, particularly through efficiency and operational improvements. In many cases, SMEs can achieve meaningful emissions reductions with shorter payback periods than large capital-intensive projects.
How long does a decarbonization program take?
Decarbonization is typically a multi-year process rather than a one-time project. Organizations often see measurable results within the first year through efficiency and optimization, while deeper emissions reductions occur over several years as equipment and infrastructure are upgraded.
How does decarbonization support ESG and sustainability reporting?
Decarbonization provides the measurable emissions reductions that underpin credible ESG and sustainability reporting. Tracking progress over time allows organizations to demonstrate accountability, transparency, and alignment with climate commitments.
What is the relationship between decarbonization and regulatory compliance?
Decarbonization helps organizations stay ahead of evolving regulations related to emissions, energy efficiency, and carbon reporting. Proactive strategies reduce compliance risk and avoid costly last-minute adjustments as requirements tighten.
Can decarbonization be tailored to specific industries?
Yes. Effective decarbonization strategies are highly site- and industry-specific. What works for a manufacturing facility may differ from a commercial building or municipal operation. Tailoring strategies ensures emissions reductions are practical, cost-effective, and aligned with operational realities.
How do organizations measure progress in decarbonization?
Progress is typically measured through energy use, emissions intensity, absolute emissions reductions, and verified savings from implemented projects. Continuous tracking helps ensure that reductions are real, sustained, and aligned with long-term goals.
What challenges do organizations commonly face when decarbonizing?
Common challenges include limited data visibility, competing capital priorities, operational constraints, and uncertainty around technologies or incentives. A phased approach helps manage these challenges while maintaining momentum.
How does Enviro-Stewards support decarbonization efforts?
Enviro-Stewards supports organizations through assessments, strategy development, implementation guidance, and ongoing performance monitoring. The focus is on practical decarbonization solutions that deliver measurable environmental and economic benefits over time.
What grants, incentives, or funding are available to support decarbonization projects?
Many decarbonization projects in Canada can be supported through a combination of government grants, utility incentives, and tax credits. These programs often target energy efficiency, electrification, low-carbon technologies, and emissions reductions. Depending on the project and sector, funding can significantly reduce upfront costs and shorten payback periods. Programs are often available at the federal, provincial, and utility level, and eligibility varies by technology, project size, and industry
Partnering with organizations, like Enviro-Stewards, allow you to keep up to date on funding available.
How do organizations typically finance decarbonization initiatives?
Organizations often finance decarbonization through a blended approach that combines internal capital, grants or incentives, and third-party financing. Common options include green loans, performance-based contracts, and energy service models where savings help repay project costs. Structuring projects to align with available incentives and cash-flow savings is a key part of making decarbonization financially viable over the long term. Enviro‑Stewards generally leverages a mix of client capital and applicable incentive programs to launch decarbonization projects. Even when external funding isn’t available, our assessments reliably uncover sufficient savings to make the project financially compelling.
EMIS
What is an Energy Management Information System (EMIS)?
An Energy Management Information System (EMIS) is a software-based platform that collects, analyzes, and visualizes energy data from buildings or facilities. It transforms raw utility and meter data into actionable insights that help organizations understand energy use, identify inefficiencies, and improve performance over time.
What problems does an EMIS help solve?
An EMIS helps organizations identify abnormal energy use, reduce waste, manage energy costs, and track performance against targets. It shifts energy management from reactive bill reviews to proactive, data-driven decision-making.
How is an EMIS different from an Energy Management System (EMS)?
An EMS is the overall management framework that defines policies, goals, roles, and processes for managing energy. An EMIS is the data and analytics layer that supports that framework by providing continuous monitoring, insights, and verification of performance improvements.
What makes Stewwi EMIS different from conventional EMIS platforms?
Stewwi EMIS is designed to track energy, water, and waste together, rather than focusing only on facility-wide energy use. It combines real-time data with engineering expertise and ongoing performance support to help organizations achieve sustained operational and sustainability outcomes.
What types of data does an EMIS typically collect?
An EMIS commonly collects electricity, natural gas, thermal energy, water, and sometimes waste data. This data may come from whole-building meters, sub-meters, SCADA systems, and operational sensors that provide context such as occupancy, production levels, or weather conditions.
Do organizations need sub-metering to use an EMIS?
While whole-building meters are a starting point, sub-metering allows for much deeper insight. Sub-meters help break down energy use by system, process, or area, making it easier to pinpoint inefficiencies and prioritize improvements.
How does an EMIS support cost savings?
An EMIS supports cost savings by identifying energy waste, reducing peak demand charges, improving operational schedules, and verifying savings from efficiency projects. Continuous monitoring helps ensure that savings persist over time rather than eroding after implementation.
Is an EMIS only useful for large or complex facilities?
No. EMIS platforms can be valuable for a wide range of organizations, from single facilities to large multi-site portfolios. Smaller organizations often benefit from improved visibility and fast identification of low-cost efficiency opportunities.
How does an EMIS support decarbonization efforts?
An EMIS provides the data foundation needed to reduce emissions by tracking energy use, identifying high-emission activities, and verifying reductions over time. This makes it a critical tool for organizations pursuing decarbonization strategies.
Can an EMIS replace energy audits?
No. Energy audits provide a snapshot in time, while an EMIS provides continuous insight. Used together, audits identify opportunities and an EMIS ensures that improvements are implemented correctly and maintained.
How do EMIS dashboards help operators and managers?
EMIS dashboards present key performance indicators, trends, and comparisons in an easy-to-understand format. This allows operators and managers to quickly see where energy use deviates from expectations and take corrective action.
How does an EMIS detect issues early?
An EMIS compares live and historical data against baselines or expected performance. When usage deviates, alerts flag potential issues such as incorrect schedules, equipment faults, or abnormal consumption before they result in high costs or comfort problems.
What is monitoring-based commissioning and how does EMIS support it?
Monitoring-based commissioning uses continuous EMIS data to identify and correct performance drift over time. Instead of one-time commissioning, facilities are continuously tuned as conditions, usage, or systems change.
How long does it take to implement an EMIS?
Implementation timelines vary based on facility size, data availability, and metering needs. Basic EMIS deployments can be completed relatively quickly, while more complex systems may be rolled out in phases to align with operational priorities.
What does it typically cost to deploy an EMIS?
EMIS costs vary widely depending on system complexity, number of meters, and analytics requirements. Many organizations treat EMIS as a capital investment due to typical payback periods of two to three years from energy savings alone.
Are grants or incentives available to help fund EMIS deployment?
Yes. In Canada, programs such as Ontario’s Save on Energy initiatives and other provincial or federal programs often provide incentives that can cover a significant portion of EMIS costs, including software, metering, and integration.
How does EMIS help justify future capital investments?
EMIS data helps organizations identify which systems or facilities offer the greatest opportunity for improvement. This supports evidence-based capital planning by showing where investments will deliver the highest impact and return.
Who typically uses an EMIS within an organization?
EMIS platforms are used by facility operators, energy managers, sustainability teams, engineers, and leadership. Each group benefits from different views of the same data, aligned to operational, financial, or sustainability goals.
Does an EMIS require in-house energy expertise to be effective?
While EMIS platforms provide powerful insights, value is maximized when data is paired with energy management processes and expertise. Many organizations work with partners, such as Enviro-Stewards, to interpret data and turn insights into action.
How does Stewwi EMIS fit into a long-term sustainability strategy?
Stewwi EMIS provides continuous visibility into energy, water, and waste performance, enabling organizations to track progress, sustain improvements, and support long-term sustainability and decarbonization goals.
Operational Efficiency
What does “operational efficiency” mean in a manufacturing environment?
Operational efficiency describes how effectively a manufacturing operation converts inputs such as energy, materials, labour, and time into saleable products with minimal waste, rework, downtime, and unnecessary cost. It focuses on maximizing value-added activity while reducing losses across the entire operation, not just individual machines.
How is operational efficiency different from productivity?
Productivity measures output relative to input, such as units produced per hour or per worker. Operational efficiency goes further by examining how those outputs are achieved, including waste, energy use, rework, downtime, and overhead. A facility can be productive while still being operationally inefficient if it relies on excessive energy, labour, or rework to achieve its output.
How is operational efficiency different from energy efficiency?
Energy efficiency focuses specifically on reducing energy use for a given activity. Operational efficiency is broader and includes energy, but also covers materials, quality, labour utilization, workflow, and equipment reliability. Many energy losses are actually symptoms of deeper operational inefficiencies.
Why is operational efficiency a critical lever for manufacturers?
Operational efficiency directly affects cost, profitability, and competitiveness. Inefficiencies such as scrap, rework, downtime, and wasted energy quietly erode margins. Improving efficiency allows manufacturers to produce more value with the same resources while strengthening resilience against rising energy, labour, and material costs. Essentially, operational efficiency helps manufacturers make more money per unit of production, leading to more revenue.
How does poor quality control reduce operational efficiency?
When products fail quality standards, the energy, materials, and labour used to produce them are often lost or must be repeated. Rework and rejected products increase operating costs, consume capacity, and waste energy. Improving quality earlier in the process is often one of the most effective efficiency improvements a facility can make.
Why is fixing problems earlier in the production process more efficient?
Issues caught early typically require less energy, labour, and material to correct. Problems discovered late in production often mean energy-intensive steps such as heating, cooling, processing, or packaging have already occurred. Addressing root causes upstream prevents waste (and the associated costs of handling the waste) from compounding downstream.
How do scrap and rework impact operating costs beyond materials?
Scrap and rework increase energy consumption, extend machine run time, raise maintenance needs, and reduce available capacity. These hidden costs often exceed the value of the wasted material itself and can significantly affect both operating costs and emissions.
How does downtime affect overall operational efficiency?
Unplanned downtime reduces throughput, increases overtime, disrupts scheduling, and often leads to inefficient restart conditions. It also masks energy waste, as equipment may consume power during idle or restart periods. Reliable operations are a foundation of operational efficiency. An energy management information system (EMIS) can help identify and quantify wasted energy costs associated with idling equipment during downtimes. An EMIS can also send automated alerts to operators when equipment is consuming energy (or water) over a set threshold.
What is Overall Equipment Effectiveness (OEE), and why is it important?
OEE measures how effectively equipment is used during planned production time by combining availability, performance, and quality. It is a valuable indicator of equipment-level losses, but it represents only one component of broader operational efficiency.
Why doesn’t OEE alone capture full operational efficiency?
OEE focuses on equipment during scheduled production time. It does not account for losses caused by excess inventory, poor scheduling, energy waste, material handling inefficiencies, or labour utilization. Operational efficiency considers the entire system, with OEE as one important input.
What operational data is needed to improve efficiency effectively?
Manufacturers need data that links energy, production, downtime, quality, and operating conditions. This includes when energy is used, how equipment performs under different conditions, where waste occurs, and how changes affect outcomes. Without reliable data, improvement efforts are often reactive or misdirected. Strategic sub-metering and incorporation of an EMIS can help link and monitor key data sources and measure outcomes to ensure operations remain as efficient as possible.
How does operational efficiency connect to sustainability and decarbonization?
Operational inefficiencies almost always increase emissions. Scrap, rework, excess energy use, and unnecessary processing all raise a facility’s carbon footprint. Improving operational efficiency reduces emissions while delivering cost savings, making it a foundational step in decarbonization strategies.
Why do energy, water, and material losses often indicate deeper inefficiencies?
Losses in energy, water, or materials usually signal problems in process control, equipment performance, or workflow design. Treating these losses in isolation may reduce symptoms, but addressing root operational causes delivers more durable and cost-effective improvements.
Furthermore, an integrated assessment of a facility that considers how the various processes are inter-related provides more robust opportunities for efficiency improvements (for example, waste heat generated in one part of a manufacturing operation can be reused elsewhere in the facility for an unrelated process).
How long does it take to implement an EMIS?
Implementation timelines vary based on facility size, data availability, and metering needs. Basic EMIS deployments can be completed relatively quickly, while more complex systems may be rolled out in phases to align with operational priorities.
What role do data and monitoring systems play in improving operational efficiency?
Monitoring systems provide visibility into real-time and historical performance, helping teams identify abnormal conditions, verify improvements, and prevent performance drift. Data turns efficiency from guesswork into a measurable, repeatable process.
How does Enviro-Stewards approach operational efficiency differently?
Enviro-Stewards approaches operational efficiency through an integrated lens that combines engineering expertise, data analysis, and sustainability outcomes. Rather than focusing on isolated fixes, the goal is to reduce waste, improve performance, and deliver measurable cost and emissions reductions that can be sustained over time. Our EMIS system, Stewwi (system to track energy, water, and waste improvements), was developed specifically for manufacturers so they can focus on what matters most to improve operational efficiency using real-time, reliable data.
Productivity
What does “productivity” mean in a manufacturing context?
In manufacturing, productivity describes how much usable output is produced relative to the inputs required to produce it. Inputs typically include labour, materials, energy, equipment time, and capital. Productivity is often expressed as units produced per labour hour, per machine hour, or per dollar of input.
At its core, productivity answers the question: How much finished product are we getting out for what we put in?
How is productivity different from operational efficiency?
Productivity focuses on output volume, while operational efficiency focuses on how intelligently resources are used to achieve that output. A facility can be productive by pushing high volumes through the system, yet still be inefficient if it relies on excessive energy use, overtime, scrap, or rework. Operational efficiency is often one of the most effective ways to improve productivity sustainably.
How is productivity different from profitability?
Productivity measures output relative to inputs, while profitability measures financial performance after costs are accounted for. Productivity gains do not automatically translate into higher profits if increased output comes with higher waste, energy use, labour costs, or quality losses. Sustainable productivity improvements are those that also reduce cost per unit and operating risk.
Why do manufacturers often struggle to define productivity clearly?
Productivity is often discussed using different metrics across departments. For example, operations may focus on throughput, finance on cost per unit, and leadership on revenue growth. Without a shared definition, productivity improvements in one area can create unintended consequences elsewhere, such as increased scrap or overtime.
How is productivity typically measured in manufacturing?
Productivity is commonly measured as output divided by input. Examples include units produced per labour hour, revenue per employee, or output per machine hour. Some organizations use multifactor productivity, which considers multiple inputs such as labour, materials, and energy together to provide a more complete picture.
What productivity metrics are most commonly used on the shop floor?
Common shop-floor productivity metrics include units per hour, cycle time, throughput, labour utilization, and first-pass yield. These metrics help teams understand how quickly and consistently products move through the system and where constraints or losses occur.
Why can productivity improve while costs or margins do not?
Productivity metrics can improve if output increases, even if the additional output requires more energy, overtime, maintenance, or rework. In these cases, productivity appears higher, but margins remain flat or decline. This is why productivity should always be evaluated alongside operational efficiency and cost metrics.
How do waste, scrap, and rework affect manufacturing productivity?
Waste, scrap, and rework consume labour, materials, and energy without increasing saleable output. They reduce effective productivity by diverting resources away from producing finished goods. In many cases, the hidden energy and labour costs of rework exceed the value of the wasted material itself.
What does “productivity” mean in a manufacturing context?
In manufacturing, productivity describes how much usable output is produced relative to the inputs required to produce it. Inputs typically include labour, materials, energy, equipment time, and capital. Productivity is often expressed as units produced per labour hour, per machine hour, or per dollar of input.
At its core, productivity answers the question: How much finished product are we getting out for what we put in?
How is productivity different from operational efficiency?
Productivity focuses on output volume, while operational efficiency focuses on how intelligently resources are used to achieve that output. A facility can be productive by pushing high volumes through the system, yet still be inefficient if it relies on excessive energy use, overtime, scrap, or rework. Operational efficiency is often one of the most effective ways to improve productivity sustainably.
How is productivity different from profitability?
Productivity measures output relative to inputs, while profitability measures financial performance after costs are accounted for. Productivity gains do not automatically translate into higher profits if increased output comes with higher waste, energy use, labour costs, or quality losses. Sustainable productivity improvements are those that also reduce cost per unit and operating risk.
Why do manufacturers often struggle to define productivity clearly?
Productivity is often discussed using different metrics across departments. For example, operations may focus on throughput, finance on cost per unit, and leadership on revenue growth. Without a shared definition, productivity improvements in one area can create unintended consequences elsewhere, such as increased scrap or overtime.
How is productivity typically measured in manufacturing?
Productivity is commonly measured as output divided by input. Examples include units produced per labour hour, revenue per employee, or output per machine hour. Some organizations use multifactor productivity, which considers multiple inputs such as labour, materials, and energy together to provide a more complete picture.
What productivity metrics are most commonly used on the shop floor?
Common shop-floor productivity metrics include units per hour, cycle time, throughput, labour utilization, and first-pass yield. These metrics help teams understand how quickly and consistently products move through the system and where constraints or losses occur.
Why can productivity improve while costs or margins do not?
Productivity metrics can improve if output increases, even if the additional output requires more energy, overtime, maintenance, or rework. In these cases, productivity appears higher, but margins remain flat or decline. This is why productivity should always be evaluated alongside operational efficiency and cost metrics.
How do waste, scrap, and rework affect manufacturing productivity?
Waste, scrap, and rework consume labour, materials, and energy without increasing saleable output. They reduce effective productivity by diverting resources away from producing finished goods. In many cases, the hidden energy and labour costs of rework exceed the value of the wasted material itself.
Sustainable Manufacturing
What is the difference between carbon neutral, net zero, and climate positive in sustainable manufacturing?
In sustainable manufacturing, the goal is to run a plant that wastes less and operates with a smaller environmental footprint, and the terms carbon neutral, net zero and climate positive are ways to measure a facility’s environmental progress. Carbon neutral means the emissions a company produces in a given year are balanced by an equivalent amount of carbon removed or offset. Net zero means the company has reduced its actual emissions as far as possible and used high-quality removals for only the small remainder that cannot be eliminated. Climate positive means it removes more carbon than it produces. The practical difference matters: carbon neutral can be reached partly through purchased offsets, while net zero is built on real operational reductions first. We help manufacturers understand which claim their data actually supports before they put it in front of a customer or investor.
How do Scope 1, 2, and 3 emissions connect to sustainable manufacturing?
Sustainable manufacturing and emissions accounting are the same problem looked at two ways. Scope 1 is direct emissions from sources the manufacturer owns or controls: natural gas combusted in boilers, ovens and dryers; diesel consumed in company-owned vehicles; refrigerant leaks, and on-site fuel combustion. Scope 2 is emissions from purchased electricity, steam, heat and cooling. Scope 3 is everything else in the value chain: purchased ingredients and materials, upstream and downstream transportation, waste generated in operations, packaging, and the use or end-of-life of sold products. In sustainable manufacturing, every improvement that saves energy, water or material reduces one of those scopes at the same time.
For food and beverage manufacturers, Scope 3 is often the largest slice, because a facility can run efficiently while still having a large emissions footprint embedded in the ingredients and materials it buys.
How does sustainable manufacturing reduce operating costs?
Most manufacturing waste is a cost you are already paying for twice. When a plant loses product or material, it has paid for the input, the energy to process it, the water and cleaning to handle it, and the disposal or rendering at the end. Fixing the root cause removes all of those costs at once. In our work with 50 food and beverage processors, we identified average savings of about $230,000 per facility per year, and in our Maple Leaf Foods engagement we found an average of roughly $350,000 in energy and water savings opportunities per facility across 33 plants. Sustainable manufacturing pays because it removes waste from the production system.
What is root-cause waste analysis in manufacturing?
Root-cause waste analysis is the practice of finding out why waste is created instead of only figuring out how to treat it or dispose of it, and it is the method behind most sustainable manufacturing gains. Rather than treating a plant’s waste as a downstream problem, we trace it back to the process: overfilling, inadequate process control, product retained in equipment, changeover losses, defective packaging, or a boiler running inefficiently. Once the cause is fixed, the waste stops, which beats managing it after the fact.
This is the core difference between waste prevention and waste management, and it is why the savings tend to be larger and more durable than end-of-pipe fixes.
Can sustainable manufacturing projects pay back in under a year?
Yes, and many do.
In our Campbell Canada work, the recommended measures were designed to avoid about 938 tonnes of food waste per year, recover roughly $706,000 in product value, and avoid about 4,000 tonnes of embedded greenhouse-gas losses annually, with a payback of less than six months. Short-payback opportunities usually come from operational changes: preventing product loss, fixing compressed-air leaks, recovering waste heat and optimizing process controls. These come before capital-heavy projects like fuel switching, because they reduce the size of the energy and emissions problem first.
What is the difference between sustainable manufacturing and operational efficiency?
Sustainable manufacturing is operational efficiency with environmental and climate goals built into it. Operational efficiency asks how to produce the required output with less time, energy, material, water, labour, downtime and cost. Sustainable manufacturing asks how to produce that output efficiently while also reducing emissions, waste, resource depletion and environmental risk. In practice they overlap heavily, because many environmental problems are caused by operational inefficiency. A plant that improves yield, reduces scrap and recovers heat has simultaneously cut cost, waste, and emissions, which is why we treat the two as the same conversation rather than separate ones.
How does sustainable manufacturing reduce Scope 3 emissions in a food plant?
A food manufacturer’s most effective sustainable manufacturing lever for Scope 3 is waste and product-loss prevention. When a plant loses a purchased ingredient, it wastes the upstream (“embedded”) emissions that went into growing, processing and transporting that ingredient, even though none of those emissions happened at the facility. Preventing the loss therefore avoids Scope 3 without a single change to the plant’s own boilers. Other sustainable manufacturing levers include supplier engagement, lower-carbon materials, packaging redesign and more efficient inbound and outbound logistics. We screen a facility’s relevant Scope 3 categories first, so you focus on the ones that actually matter to your footprint rather than measuring everything.
In sustainable manufacturing, should you electrify before or after improving efficiency?
After. Electrifying an inefficient process can cut direct emissions while still leaving the plant with unnecessary energy use and wasted capital, which defeats the point of sustainable manufacturing. The more reliable order is to first avoid unnecessary energy use, then improve process efficiency, then electrify suitable fossil-fuel processes, then procure lower-carbon electricity, and only then manage any residual emissions. This hierarchy keeps a manufacturer from decarbonizing a process that should have been redesigned in the first place, and it usually makes the electrification project smaller and cheaper.
Why does a marginal abatement cost curve matter in sustainable manufacturing?
A marginal abatement cost curve helps a manufacturer choose which sustainable manufacturing projects to fund first, by ranking every emissions-reduction option by the cost of avoiding one additional tonne of CO2e. Projects that both save money and cut emissions sit below zero on the curve, and those are the best first steps on any net-zero pathway because they pay for themselves.
The curve lets a manufacturer compare very different options on the same cost-per-tonne basis: boiler optimization, refrigeration improvements, waste prevention, electrification, renewable energy procurement and packaging redesign. That is how capital gets allocated to the sustainable manufacturing projects that reduce the most emissions per dollar.
How long does a sustainable manufacturing assessment take?
A typical sustainable manufacturing assessment runs over several weeks and covers the plant’s energy use, water use, material flows, waste streams and production processes. We pull utility bills, fuel records, production data and waste manifests, then trace losses back to their root causes rather than relying on high-level annual totals. The output is an opportunity register that quantifies each project’s annual savings, capital cost, payback and tonnes of CO2e reduced. From there we build a customized roadmap and a plan for implementation and verification. Most plants walk away with a prioritized list they can fund and act on, not just a report – and we’re here to help every step of the way on the journey from ideas to implemented measures.
How much does food waste cost a food manufacturer?
Food waste is a direct drain on margin because it represents purchased input, processing energy, water, packaging, labour and disposal all thrown away at once. In our work across food and beverage processors, we identified average savings of about $230,000 per facility per year from food-loss prevention, and the Campbell Canada project identified about $706,000 in annual product value from measures that avoided roughly 938 tonnes of waste. The financial case is strongest where waste prevention is treated as a production problem, not a disposal problem, which is exactly what sustainable manufacturing does.
How do energy and water audits drive sustainable manufacturing?
An energy and water audit is the starting point for sustainable manufacturing because it shows where resources are being lost before they turn into emissions. High gas use often traces to inefficient boilers, steam losses, and poor heat integration. High electricity use traces to motors, compressed air, refrigeration and scheduling. High water use traces to over-rinsing and ineffective cleaning, inefficient fixtures or equipment, broken valves, and undetected leaks. Once we map those losses, each fix becomes a reduction in operating cost and a reduction in Scope 1 or Scope 2 emissions at the same time. The audit turns a vague sustainability goal into a prioritized list of funded projects.
What is an opportunity register and how is it used in sustainable manufacturing?
An opportunity register is the prioritized list of improvements that turns a sustainable manufacturing assessment into action (that’s why we like to call it an “Action Plan”). It records, for every improvement the assessment identifies, the annual energy or cost savings, the capital cost, the simple payback, the tonnes of CO2e reduced, the scope affected and the implementation complexity. Managers use it to decide which projects to fund and in what order, usually starting with the no-cost and low-cost items that pay back fastest. It turns assessment findings into a capital-allocation decision instead of a shelf report.
What are the first steps to a net-zero manufacturing plan?
A credible net-zero plan starts with a baseline, not a target, and that baseline comes from sustainable manufacturing. First, define the organizational and operational boundaries and the baseline year. Second, build a Scope 1 and 2 inventory and screen the relevant Scope 3 categories. Third, identify reduction opportunities and rank them by cost, emissions impact and payback. Fourth, set interim targets that are time-bound and quantified, not just a distant “2050” ambition. Finally, sequence the projects, assign accountability and put a measurement-and-verification plan in place. This aligns with guidance like the Government of Canada’s SME Net-Zero Challenge, and it keeps offsets for genuinely residual emissions after reductions are exhausted.
What is the best order to reduce manufacturing emissions?
The most cost-effective order to reduce manufacturing emissions follows the sustainable manufacturing sequence: prevent losses first, reduce energy and water demand second, improve equipment and process efficiency third, then electrify appropriate operations, then procure low-carbon energy, then redesign products, materials and supply chains, and only finally address genuinely residual emissions with high-quality measures. Offsets come last, not first. This sequence works because the earliest steps shrink the problem, which makes every later step smaller and cheaper. A manufacturer that follows it builds a defensible pathway toward net zero while improving profitability along the way.
FAQs
Case Studies
Case Studies
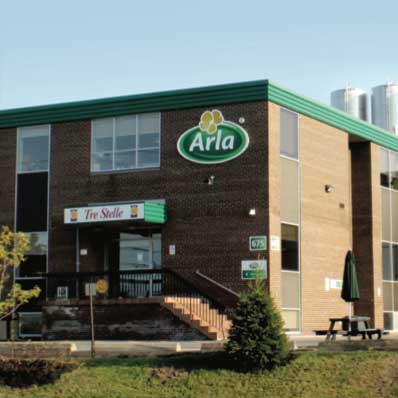
Arla Foods
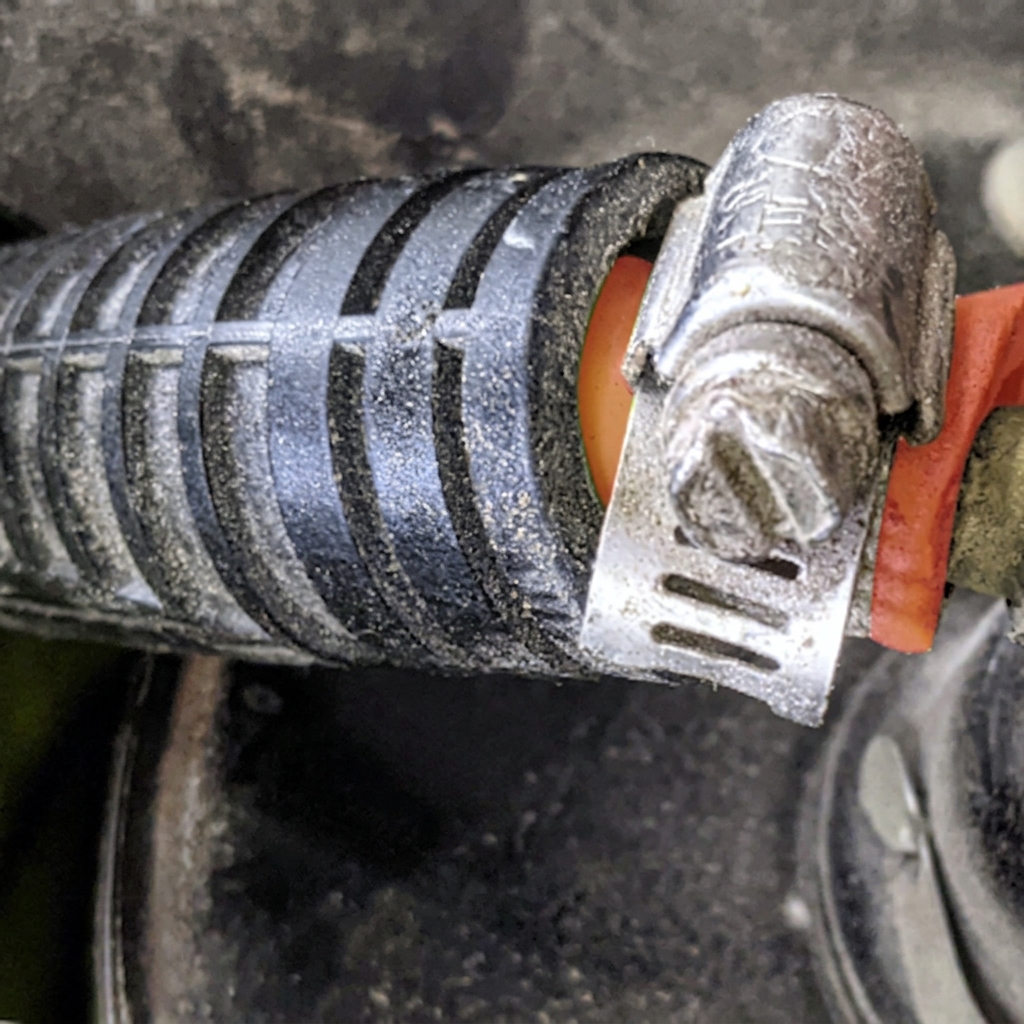
Compressed Air Leak
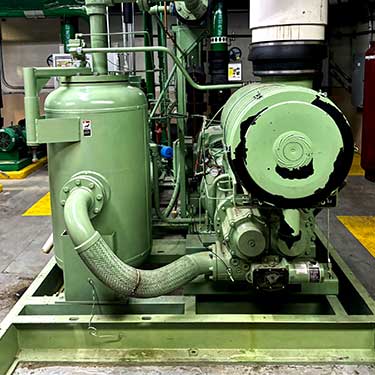
EMIS

Jackson Triggs winery
Maple Leaf Foods

Southbrook Winery
Trimac Transportation
Let’s discuss your corporate sustainability, and how we can help.