
When margins get squeezed, sustainability programs are often the first to go. The logic sounds reasonable: defer the environmental initiatives until the business stabilizes, then revisit them when there’s a budget to spare.
It’s a reasonable-sounding argument. It’s also wrong.
The assumption behind that thinking is that operational efficiency and sustainability pull in opposite directions. That running leaner means running less clean. That tightening the operation requires loosening the environmental commitments.
But in manufacturing, the most powerful cost reductions come from cutting the same things sustainability targets: energy waste, material inefficiency, water overconsumption, process losses, and unplanned downtime. They share the same enemy.
In this blog, let’s explore why the efficiency-versus-sustainability trade-off is a false one, where the overlap shows up inside real manufacturing operations, and how organizations that build visibility into their resource consumption consistently capture both financial and environmental performance at the same time.
The Misconception Costing You Money
The either-or framing has roots in how sustainability has historically been positioned: as a compliance cost, a reporting burden, or a reputational investment. Under that framing, it’s a line item. And line items get cut.
But that framing is outdated and, increasingly, expensive to hold onto.
Research across manufacturing sectors shows that sustainable manufacturing practices (energy efficiency, waste reduction, material optimization) can reduce total manufacturing costs by up to 15%. Not by cutting output. By eliminating waste that was always there, just never surfaced as a priority.
The reason the trade-off thinking persists is largely a measurement problem. When sustainability and operations are tracked in separate systems, with environmental KPIs in one report and financial KPIs in another, they look like competing programs.
The integration between them is invisible.
Bring them together under shared metrics and the picture changes. Energy cost per unit of output. Water consumed per tonne of product. GHG intensity relative to production volume. These numbers reveal where waste is simultaneously eroding margins and environmental performance.
The manufacturers who recognize this stop asking “can we afford sustainability?” and start asking “which efficiency projects deliver the biggest sustainability return per dollar invested?” That is a fundamentally different question, and it leads to fundamentally different decisions.
What Efficiency and Sustainability Actually Share
Operational efficiency is built around identifying and reducing inefficiencies across a company’s operations. These inefficiencies typically fall into a few broad categories: overproduction, too much waiting between process steps, unnecessary movement of materials or use of equipment, overprocessing, excess inventory, inefficient procedures, quality issues that generate waste or require rework, and underutilized capacity of people and equipment..
Some practitioners now add one more: energy.
That addition matters more than it might appear. When energy is treated as a form of operational efficiency rather than a fixed operating cost, new issues come into view. Hidden electricity loads tied to overproduction. Compressed air systems running at full capacity during idle periods. HVAC and process equipment operating outside optimal setpoints.
Every one of those inefficiencies has two tails: a financial cost and an environmental one. Cutting overproduction doesn’t just reduce inventory carrying costs. It also reduces the energy and materials consumed to make products that weren’t needed yet. Fixing compressed air leaks doesn’t just lower the utility bill. It also lowers the GHG emissions tied to that electricity consumption.
The same logic extends across the full resource picture of a manufacturing operation:
- Scrap and rework: Every defective part or wasted ingredient contains embodied energy and raw materials. Eliminating rework and waste improves yield, cuts disposal costs, and reduces the upstream emissions from production that never resulted in a sellable product.
- Food loss and waste: Food waste is often seen as a fixed and relatively inexpensive source of waste to dispose of. However, when you include the purchase cost of the ingredients (not to mention the labour, materials, and heating/cooling energy embedded in the food waste), the financial costs can be significan, up to 10x the disposal cost. Furthermore, it’s estimated that wasted food is the third largest GHG contributor globally, behind the USA and China. So reducing food waste also has significant environmental benefits as well. A food loss & waste prevention project Enviro-Stewards participated in at 50 food & beverage facilities across Canada identified opportunities that will save, in total, $11.4 Million/year in financial savings and 32,600 tonnes CO2e/year in emissions reductions (read more about food loss & waste prevention).
- Water and effluent: Closing process water loops and reducing leaks cuts both utility procurement costs and wastewater treatment expenses, while lowering environmental risk and liability.
- Material efficiency: Designing for less material use or higher recycled content lowers input costs, reduces waste-hauling fees, and shrinks lifecycle impact.
An Enviro-Stewards client calculated that their management cost to dispose of wasted product was $100/tonne, so their 13 tonnes of waste/year was only costing them $1,300/year. However, when it was demonstrated that the ingredient purchase cost needed to be included in that calculation, the real cost to the company for that waste was $130,000/year ($10,000/tonne)! As such, the economic and environmental motivation for finding ways to prevent this waste became much stronger, and we were able to address the root cause of the waste and reduce it at source.
These aren’t green programs. They’re operations improvements with environmental co-benefits built in.
The Win-Win Levers in Practice
Knowing the theory is useful. Knowing where to look inside a manufacturing facility is better.
The highest-leverage areas where operational efficiency and sustainability reinforce each other cluster around a few consistent categories.
Energy-Intensive Processes
High-efficiency motors, variable frequency drives, compressed air audits, waste heat recovery, and setpoint optimization are established starting points. Each project targets energy waste directly. The outputs are lower kWh or fuel consumed per unit of output, a lower energy bill, and reduced CO2-equivalent per unit produced.
Enviro-Stewards’ work with Gay Lea identified projects that would save them over 5,000,000 m3/year in natural gas, over 300,000 m3/year in water, resulting in an expected financial savings of almost $4 million/year. These process optimization measures are estimated to save 9,600 t CO2e/year in emissions. These initiatives earned Gay Lea a national sustainability award.
Water and Effluent Management
Manufacturers in food and beverage, industrial processing, and institutional facilities often find significant water reduction opportunities through loop closure, leak identification, reuse, and cleaning cycle optimization. Savings appear on two cost lines: lower water procurement and lower wastewater treatment. The environmental footprint shrinks accordingly.
Our team conducted a detailed water audit of a manufacturer that was experiencing background water consumption during non-production hours. The team identified 4 major sources contributing to the background consumption, most of which could be repaired immediately. Overall, the water audit identified total savings of 32,000 m3/year of water, 75,000 m3/year of natural gas (hot water), totalling $175,000/year in financial savings.
Food manufacturers in particular can be resistant to water conservation, because less water use results in higher concentrations of effluent parameters (such as biochemical oxygen demand, BOD) that can lead to increases in sewer surcharge fees. However, our team has demonstrated to clients that even with a slightly higher surcharge fee, there is still a net financial savings due to lower water bills associated with the implemented water conservation measures.
The Circular Economy and By-Product Reuse
Treating waste streams as resources (through internal reuse or external partnerships) reduces disposal costs and, in some cases, generates new revenue from materials that were previously a liability. For manufacturers with high-volume by-product streams, this is often materially significant over a multi-year horizon. For example, the spent grains from a brewery can be used as an ingredient for bread in a nearby bakery.
The pattern across all of these levers is consistent: when you pursue operational excellence rigorously, environmental performance follows. Not as a side effect. As a direct outcome of the same actions.
High Park brewery is a Certified B Corporation in Toronto, Ontario. The brewery was previously purchasing empty bottles in boxes. After filling them, the bottles were returned to the boxes and stored in the fridge. As bottles were sold, empty boxes were broken down by staff, then recycled for a fee. Switching to bulk bottle purchases yielded economic savings and enabled the brewery to deploy reusable plastic crates vs.cardboard boxes. Once empty, the plastic crates are reused. The benefits of this circular approach for bottles and crates included much better durability, 20 bottle capacity for the plastic crates (previously 12), no paid wages to break down the cardboard boxes, no cardboard recycling fees, and the crates can be sold to customers to reuse (you can read the full case study here).
Visibility Is the Prerequisite
None of the efficiency gains described above can be sustained without data.
The challenge most manufacturing operations face isn’t a lack of good intentions. It’s a lack of visibility. Energy gets billed monthly in aggregate. Water consumption is tracked at the facility level. Materials move through processes without granular loss accounting. Without equipment-level or process-level data, identifying where waste is occurring, and verifying that interventions worked, is largely guesswork.
This is the gap that an Energy Management Information System (EMIS) is designed to close.
An effective EMIS moves sustainability data from the quarterly environmental report into the daily operational workflow. It turns consumption metrics into actionable signals: flagging abnormal equipment loads, identifying inefficient operating patterns, tracking project savings in real time, and building the evidence base for future capital investments.
Stewwi, Enviro-Stewards’ proprietary EMIS platform, is built for exactly this function. It integrates automated utility tracking, GHG reporting, project performance monitoring, and equipment-level consumption insights into a single operational view. The goal isn’t more dashboards. It’s fewer surprises and faster decisions.
Enviro-Stewards implemented Stewwi at a client’s facility that included metering its air compressors. The Stewwi data revealed high power consumption from air compressors (>250 kW baseline) when demand should be minimal, so an air leak audit was conducted. Following repair of the leaks, the baseline dropped to 200 kW, resulting in a savings of $50,000/year (440,000 kWh). Continued monitoring via Stewwi can alert facility staff when the power consumption creeps upward again, triggering another air leak audit to maintain the savings.
When leadership can see energy cost per unit trending alongside emissions intensity per unit, the conversation about sustainability stops being a budget discussion and starts being a performance discussion.
Ready to see what’s hiding in your energy data? Book a Stewwi EMIS demo and find out where your facility is losing both cost and carbon. Book a demo today! |
The Business Case Leadership Needs to See
For sustainability-driven efficiency projects to gain traction inside a manufacturing organization, they need to speak in the language of operations leadership — not environmental reporting.
That means dual KPIs from the start of every project.
Rather than tracking energy savings and carbon reductions in separate systems, forward-thinking manufacturers are building shared dashboards that pair financial performance with resource intensity metrics:
• Energy cost per unit of good output
• Water consumed per tonne of product
• GHG intensity relative to revenue or production volume
• Scrap rate measured simultaneously as a quality metric and a material waste metric
When these numbers trend down together, two things happen. First, the efficiency project proves its ROI in terms leadership already cares about. Second, the argument that sustainability costs money starts to collapse under the weight of its own evidence.
There is also a risk-management dimension that is increasingly difficult to ignore. Carbon pricing mechanisms, supply-chain ESG audit requirements, and climate-related disclosure obligations are tightening across both Canadian and US manufacturing contexts. Organizations that have already embedded efficiency-driven sustainability into operations are better positioned to absorb those pressures, because they have reduced their exposure at the source rather than simply documenting it.
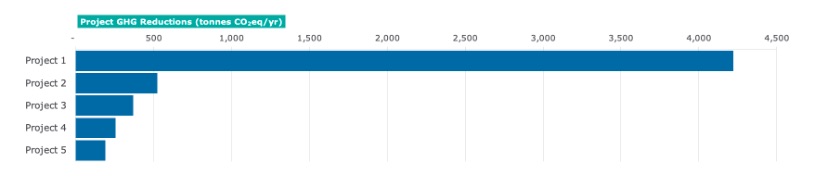
A dashboard such as the one below (via Stewwi) can help leadership make decisions about where to invest first depending on financial or environmental factors. In the dashboard below, a financial focus would help leadership decide to implement Projects 1 & 2 first because they would yield the most significant financial savings.

Conversely, if leadership would like to base their decision about what to implement first based on environmental impact, Project 1 should be implemented first. In this example, Project 1 has the added benefit of also being the most financially lucrative option to implement, which is a win-win for economic and environmental benefit. Leadership could also evaluate the same dashboard based on dollar or GHG savings on a per-unit-of-production (or other) basis, depending on what their preferred metric is for making decisions.
The manufacturers building the most resilient operations are the ones treating sustainability as an operational strategy, not a reporting obligation.
Where to Start
The gap between understanding this and acting on it is usually not convincing. It’s prioritization.
For most manufacturers, the right starting point is a structured energy and resource audit. A baseline assessment that maps current consumption patterns, identifies the highest-loss areas, and quantifies the opportunity before any capital is committed. Starting with data beats starting with assumptions.
The projects that deliver the fastest payback tend to share a few characteristics. They target chronic inefficiencies that have been normalized over time: equipment running outside optimal parameters, processes designed for production volumes that no longer reflect current reality. They require modest capital relative to the savings they generate. And they produce results that are measurable, verifiable, and attributable to a specific change, which builds the internal case for the next project.
Organizations that commit to building a real baseline (energy, water, waste, and emissions per unit of output) are consistently better positioned to sequence their investments and demonstrate return.
Enviro-Stewards’ recommended measures for immediate implementation typically have paybacks of 2 years (and often less than 1 year).
The goal is not a sustainability strategy that runs parallel to operations. It’s an operations strategy that makes sustainability an output.
The Question That Changes Everything
The question facing manufacturing leaders today is not “efficiency or sustainability.” That trade-off does not hold up under scrutiny.
The real question is: which efficiency projects generate the largest sustainability return per dollar invested? And which environmental commitments will drive the most meaningful operational improvements?
Those are the same question, asked from two different starting points.
Organizations that recognize the overlap stop treating environmental programs as costs to be defended in the next budget cycle. They start treating them as a source of operational intelligence, a signal about where waste, inefficiency, and margin erosion are hiding inside their own operations.
Enviro-Stewards works with manufacturers to find and act on exactly that. From structured energy and resource audits to continuous EMIS monitoring with Stewwi to full decarbonization roadmaps, the work starts with data and ends with verified, measurable savings.
Start With a Free Consultation
Talk to an Enviro-Stewards engineer about where the overlap between efficiency and sustainability is worth the most in your operation. Schedule a call today.